When you play a perfect fifth on the violin, a third, lower pitch emerges below the two played notes. Violinists use this "third tone" to check their intonation. The note is not on the instrument, not in the room acoustics, and not coming from any speaker. It is generated inside the listener's ear.
Giuseppe Tartini documented this in his Trattato di Musica secondo la vera scienza dell'armonia, published in Padua in 1754. He had first noticed it in 1714, forty years before he wrote it down. What he was hearing is now understood as a consequence of cochlear nonlinearity: the same mathematical phenomenon that produces intermodulation distortion in amplifiers, speakers, and plugin processors.
The Math Behind New Frequencies
Any system whose output is not a simple linear multiple of its input will produce new frequencies from multi-tone inputs. The explanation comes from Taylor series expansion. A weakly nonlinear device can be approximated as a polynomial:
y(t) = a₁·x(t) + a₂·x(t)² + a₃·x(t)³ + ...Feed two tones, x(t) = cos(2πf₁t) + cos(2πf₂t), into this polynomial. The quadratic term generates product frequencies at f₁+f₂ (sum) and f₂-f₁ (difference). The cubic term generates 2f₁-f₂ and 2f₂-f₁. These are intermodulation products: frequencies that were not in the input signal, created by the nonlinearity of the system itself.
Second-order products are spaced at the sum and difference of the input frequencies. Third-order products are more problematic for audio because they land close to the original tones. If an amplifier receives 1 kHz and 1.5 kHz simultaneously, its third-order products appear at 500 Hz and 2 kHz, directly in-band and indistinguishable from intended signal content.
The behavior with level is what makes third-order IMD especially dangerous in audio work. The signal itself grows at 1 dB per dB of input increase. Third-order products grow at 3 dB per dB. Every 1 dB you push a nonlinear system, the IMD products gain 2 dB on the signal. Headroom vanishes faster than THD measurements at a single level would suggest.
The Cochlea as a Distortion Generator
Here is the part that changes how you think about perceived sound quality. The outer hair cells (OHCs) in the cochlea amplify quiet sounds through a process called electromotility: they physically change length in response to electrical stimulation, feeding mechanical energy back into the basilar membrane. This amplification is not linear. The OHCs operate at a nonlinear region of their response curve, which means they generate intermodulation products from any multi-tone input, exactly like an overdriven amplifier stage.
The evidence that combination tones originate inside the ear rather than in the brain came from audiology studies in the 1970s and 1980s. Subjects with cochlear damage in specific frequency regions could not hear combination tones generated in those regions, even when both primary tones were clearly audible through intact portions of the cochlea. The combination tone is not reconstructed centrally. It propagates physically on the basilar membrane.
More direct confirmation comes from otoacoustic emissions. The ear actively broadcasts its distortion products outward as measurable acoustic pressure in the ear canal. A calibrated microphone placed in the ear canal can record the cubic difference tone 2f₁-f₂ being emitted by the cochlea while the ear receives the two primaries f₁ and f₂. The ear is not just a passive receiver with some distortion. It is generating and emitting intermodulation products.
At moderate stimulus levels, cochlear distortion can exceed 10 percent of total harmonic distortion. Any piece of audio equipment measured at that figure would be commercially unacceptable. Cochlear nonlinearity is not a defect. It is the mechanism by which the basilar membrane achieves its extraordinary sensitivity, roughly 120 dB of dynamic range in a biological system that would otherwise manage a fraction of that.
How Audio Equipment Is Actually Tested for IMD
In electronic devices, intermodulation distortion is measured separately from harmonic distortion because the two tests reveal different failure modes. Total harmonic distortion measures how a device handles a single frequency. IMD measures what happens when the device handles multiple frequencies simultaneously, which is the only scenario that matters for audio.
The SMPTE RP120-1994 standard uses two tones: 60 Hz at four times the amplitude of a 7 kHz signal. The low-frequency tone amplitude-modulates the high-frequency tone as both pass through the device under test. Sidebands appear at 7060 Hz, 6940 Hz, 7120 Hz, 6880 Hz and so on, at 60 Hz intervals around the carrier. The ratio of sideband energy to the 7 kHz carrier level is the IMD figure.
A device can measure very low THD at 7 kHz in isolation while producing significant SMPTE IMD when driven by a realistic signal. This is the primary limitation of single-tone THD measurements: real audio content drives nonlinear systems with many simultaneous frequencies. IMD tests are a better predictor of how a device sounds under real conditions.
The Tube Distortion Myth, More Precisely
The common characterization of tube amplifiers as producing "pleasant even-order harmonics" while transistor designs produce "harsh odd-order ones" is a simplification that breaks down at the topology level.
Single-ended tube stages produce asymmetrical distortion, meaning that positive and negative half-cycles are treated differently. This asymmetry generates both even and odd-order products simultaneously. A push-pull configuration combines the outputs of two out-of-phase stages through a transformer. The even-order components cancel through this phase inversion, leaving only odd-order intermodulation products. High-end tube manufacturers used push-pull designs partly for this reason. The irony is that the tube configuration often associated with warm sound, single-ended, produces more IMD than the push-pull designs it is contrasted against.
What actually distinguishes different saturation characters is the symmetry and order of the transfer function, not the component type. A symmetric saturation function like f(x) = tanh(x) generates third-order products and odd harmonics. An asymmetric function like f(x) = tanh(x + 0.2) shifts the operating point and generates a full mix of even and odd products. Both are valid as saturation treatments, but they interact differently with complex input material because they generate different IMD product sets.
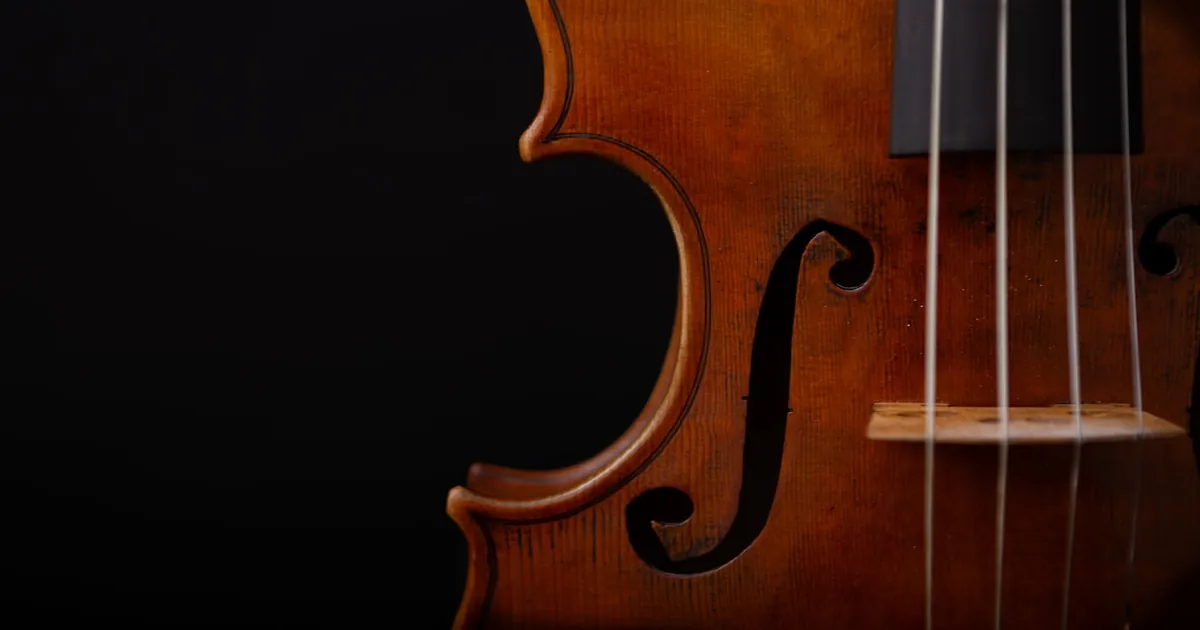
Tartini Tones as a Tuning Tool and a Quality Indicator
Violinists use the terzo suono as a practical intonation check. When playing a perfect fifth cleanly tuned, the Tartini tone falls exactly one octave below the lower of the two notes. Any deviation from pure intonation shifts the combination tone in a way that is immediately audible as beating.
A 2024 study by Italian researchers compared a 1700 Bologna violin by Carlo Annibale Tononi to a factory-made instrument from 2013. The antique instrument generated Tartini tones that were audible without special equipment. The modern factory violin produced barely measurable combination tones. The structural nonlinearity of the resonant body, determined by wood density gradients, varnish, and craftsmanship, controls whether the instrument generates audible Tartini tones. The mechanism is the same polynomial nonlinearity described in the Taylor expansion above.
Tartini heard all of this from inside a practice room in 1714, without differential equations, without measurement equipment, and without knowing that the same phenomenon would later be used to diagnose hearing device performance and cochlear function. The frequencies were there either way.